Edit patterns for OpenStreetMap amenities
The extract-amenities script outputs all the map elements in an OpenStreetMap file that have an amenity=..-tag. Also, if an element has multiple versions, all versions are extracted starting from the first version with an amenity=..-tag. An example of how to load and work with this data in R can be found here. The purpose of this analysis is to use the same amenity data (the full export from 10.8.2015) and plot the edit intensity patterns for the top-75 amenities. These roughly correspond to those amenities with more than 5000 unique map elements when counted over the entire history of the OSM, that is, when we also include map elements that are currently deleted.
There are two plots for each amenity:
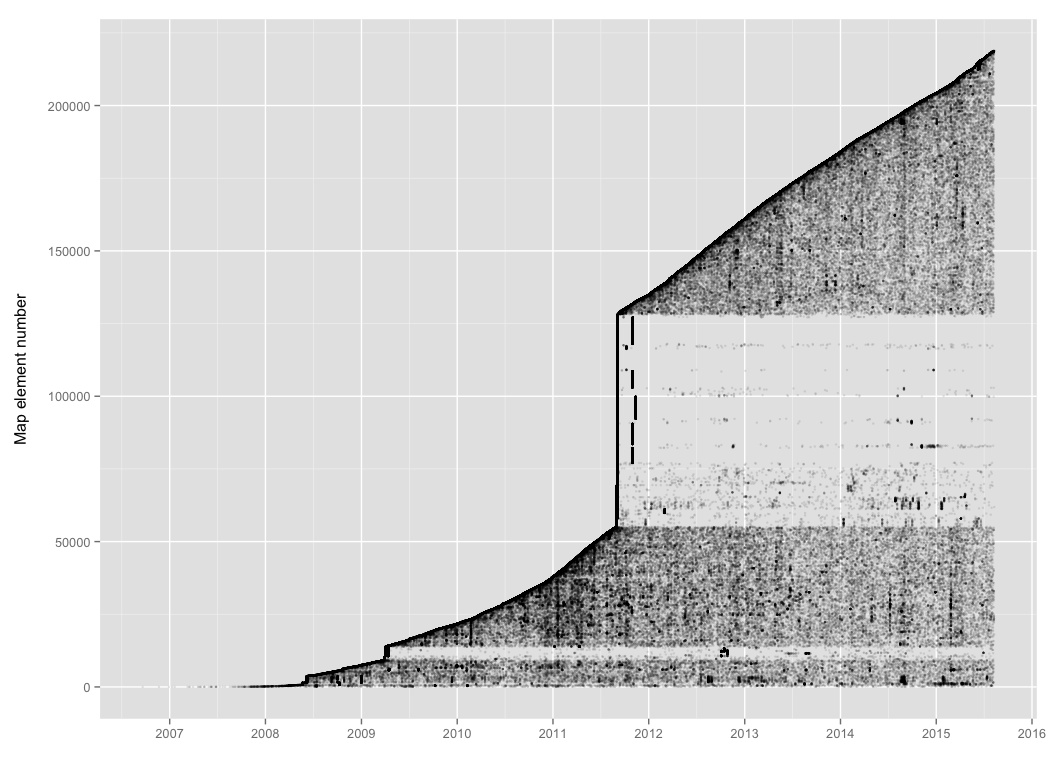
Edit intensity: In the first plot, the x-axis represents time, the y-axis represents all the map elements with a specific amenity tag, and edits are represented by points whose darkness increase with edit intensity. On the y-axis, the elements are ordered chronologically by the date a first amenity=.. tag was added to a map element. Due to the large number of map elements, the data in these plots is highly compressed. For example, the first plot visualizes the ca. 2 million unique map elements that have ever had an amenity=parking-tag, and on-screen these are mapped onto ca. 500-1000 pixels.
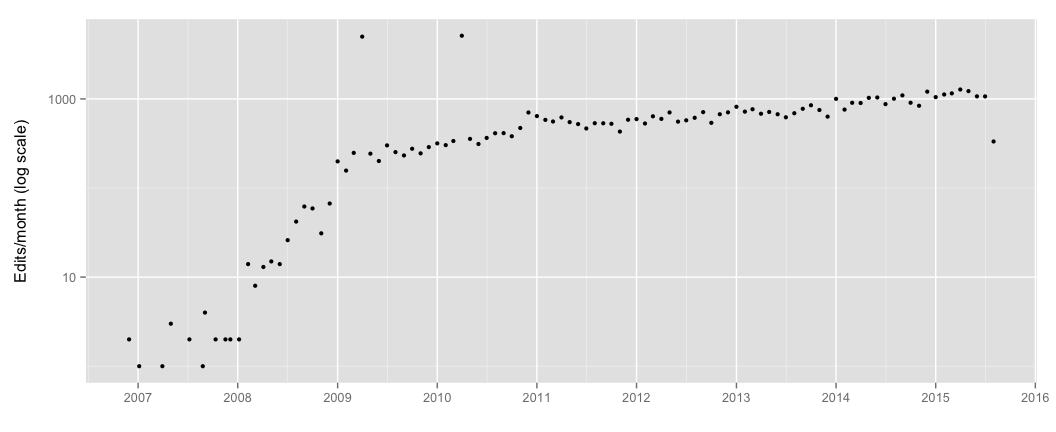
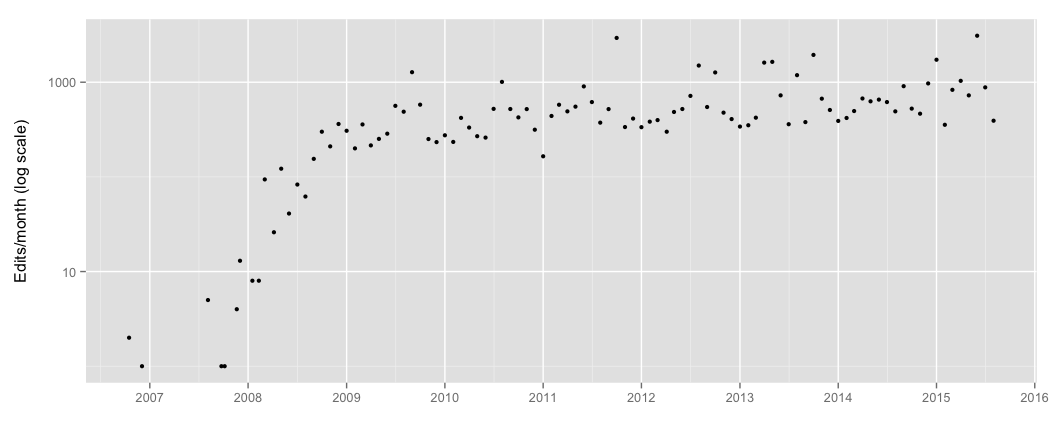
Edits/month: For each amenity, the second plot shows the total number of edits per month.
Notes
-
In the edit intensity plots, the y-scale is linear and time is discretized by week. In the edits/month plots, the y-scale is logarithmic and time is discretized by month. In both plots, deleting and undeleting are counted as edits. So, if an map element was added in 2009 and deleted in 2010, the element would only contribute to the activity for those years. Also, if the amenity tag of an element is changed, say, from
amenity=cafetoamenity=restaurant, the element appears in the plots for both tags. -
Many of the intensity plots show growth by large jumps and contain dark vertical lines. These should correspond to database imports/automatic edits by bots, see the OSM wiki. The plots indicate that elements that have been imported from databases typically have a lower edit intensity when compared to normal entries. In the plots, this is seen as lighter horizontal bands at the location of the vertical jumps. See for example the plot for the amenity
school(at rank 2). -
The first plot visualizes more than 3.6 million edits to the OpenStreetMap, and the last plot around 12000. These are different orders of magnitude, and therefore the plots are also drawn with slightly different plotting parameters. This is to improve readability and contrast. As a consequence, the absolute shades in different plots are not comparable.
-
In the intensity plots, the region close to the creation date is often darker than average. This behavior can be seen in the first few plots (with the most map elements). This would suggest that an element is more frequently edited shortly after it has been created. However, in the intensity plots with fewer elements, this is not visible. This could be due to the way the plots are rendered (see previous note).
-
Some of the graphs show a clear seasonal variation. See e.g. the plots for
bench(rank 5) andbiergarten(rank 63).
Plots
Amenity: parking (rank 1, unique elements = 2.1M)


Amenity: school (rank 2, unique elements = 903.6k)


Amenity: place_of_worship (rank 3, unique elements = 891.1k)


Amenity: restaurant (rank 4, unique elements = 598.1k)


Amenity: bench (rank 5, unique elements = 526.5k)


Amenity: fuel (rank 6, unique elements = 349.3k)


Amenity: bank (rank 7, unique elements = 220.5k)


Amenity: kindergarten (rank 8, unique elements = 218.8k)


Amenity: fast_food (rank 9, unique elements = 218.6k)


Amenity: cafe (rank 10, unique elements = 218.5k)


Amenity: post_box (rank 11, unique elements = 200.5k)


Amenity: hospital (rank 12, unique elements = 199.5k)


Amenity: grave_yard (rank 13, unique elements = 189.0k)


Amenity: public_building (rank 14, unique elements = 179.5k)


Amenity: pharmacy (rank 15, unique elements = 166.0k)


Amenity: recycling (rank 16, unique elements = 164.8k)


Amenity: post_office (rank 17, unique elements = 153.4k)


Amenity: pub (rank 18, unique elements = 149.0k)


Amenity: bicycle_parking (rank 19, unique elements = 137.9k)


Amenity: waste_basket (rank 20, unique elements = 137.6k)


Amenity: toilets (rank 21, unique elements = 130.3k)


Amenity: shelter (rank 22, unique elements = 129.8k)


Amenity: police (rank 23, unique elements = 109.2k)


Amenity: swimming_pool (rank 24, unique elements = 104.8k)


Amenity: drinking_water (rank 25, unique elements = 104.7k)


Amenity: telephone (rank 26, unique elements = 102.7k)


Amenity: atm (rank 27, unique elements = 101.5k)


Amenity: fire_station (rank 28, unique elements = 99.4k)


Amenity: bar (rank 29, unique elements = 97.2k)


Amenity: townhall (rank 30, unique elements = 94.6k)


Amenity: university (rank 31, unique elements = 83.5k)


Amenity: parking_space (rank 32, unique elements = 80.1k)


Amenity: library (rank 33, unique elements = 70.4k)


Amenity: hunting_stand (rank 34, unique elements = 69.3k)


Amenity: fountain (rank 35, unique elements = 66.8k)


Amenity: vending_machine (rank 36, unique elements = 65.5k)


Amenity: doctors (rank 37, unique elements = 57.1k)


Amenity: social_facility (rank 38, unique elements = 54.5k)


Amenity: bus_station (rank 39, unique elements = 54.1k)


Amenity: college (rank 40, unique elements = 48.0k)


Amenity: nursing_home (rank 41, unique elements = 43.7k)


Amenity: car_wash (rank 42, unique elements = 40.8k)


Amenity: marketplace (rank 43, unique elements = 37.4k)


Amenity: community_centre (rank 44, unique elements = 32.3k)


Amenity: dentist (rank 45, unique elements = 31.1k)


Amenity: emergency_phone (rank 46, unique elements = 30.9k)


Amenity: waste_disposal (rank 47, unique elements = 30.7k)


Amenity: theatre (rank 48, unique elements = 30.5k)


Amenity: fire_hydrant (rank 49, unique elements = 26.1k)


Amenity: residential (rank 50, unique elements = 26.0k)


Amenity: wlan (rank 51, unique elements = 26.0k)


Amenity: cinema (rank 52, unique elements = 25.2k)


Amenity: taxi (rank 53, unique elements = 23.7k)


Amenity: bicycle_rental (rank 54, unique elements = 22.3k)


Amenity: clinic (rank 55, unique elements = 21.9k)


Amenity: parking_entrance (rank 56, unique elements = 19.9k)


Amenity: veterinary (rank 57, unique elements = 17.7k)


Amenity: arts_centre (rank 58, unique elements = 15.8k)


Amenity: courthouse (rank 59, unique elements = 15.4k)


Amenity: nightclub (rank 60, unique elements = 15.0k)


Amenity: ferry_terminal (rank 61, unique elements = 14.1k)


Amenity: bbq (rank 62, unique elements = 12.8k)


Amenity: biergarten (rank 63, unique elements = 10.9k)


Amenity: car_rental (rank 64, unique elements = 10.0k)


Amenity: grit_bin (rank 65, unique elements = 9.4k)


Amenity: embassy (rank 66, unique elements = 9.2k)


Amenity: prison (rank 67, unique elements = 8.8k)


Amenity: shower (rank 68, unique elements = 8.1k)


Amenity: clock (rank 69, unique elements = 8.0k)


Amenity: driving_school (rank 70, unique elements = 7.2k)


Amenity: charging_station (rank 71, unique elements = 6.9k)


Amenity: ice_cream (rank 72, unique elements = 6.8k)


Amenity: car_sharing (rank 73, unique elements = 6.5k)


Amenity: bus_stop (rank 74, unique elements = 5.9k)


Amenity: unterschiedlich (rank 75, unique elements = 5.3k)


OSM License
The above analysis contains data from the OpenStreetMap project, (c) OpenStreetMap contributors. The OSM data is available under the ODbL. The R code for this analysis is available on Github.