Finding related amenity tags on OpenStreetMap
Update 18.12.2015: The website matiasdahl.github.io/osm-tag-dynamics is a continuation of the below blog post. It makes it possible to interactively explore tags related to the top 100 amenity tags.
This analysis studies amenities on the OpenStreetMap. These are identified by an amenity-tag that can contain free-form text. Say, amenity=school, amenity=picnic_table or amenity=water_point. General information about amenities and their use on the OpenStreetMap is collected on the OSM wiki, and statistics about the most popular tags (including amenity tags) can be found on the taginfo webpage.
More in detail, this work focuses on: How do amenity tags change? The motivation is that by tracking changes, we can find internal relationships between the tags. We will see, for example, that a common pattern is that amenity=hospital-tags are edited into amenity=clinic-tags. This is also understandable. A hospital (OSM wiki) and a clinic (OSM wiki) could potentially be mixed up. Similarly, both park_bench and bench have been used, and there are edits that change one tag into the other. On the other hand, we should not expect a pattern where, say, a significant number of benches are regularly retagged into fire stations. With this as motivation, we extract all amenity tag changes from the entire history of the OSM. From this data we can draw links between amenity tag-pairs, and for each link tag_a → tag_b we count how many individual map elements have changed from tag_a to tag_b. This gives amenity tags the structure of a weighted directed graph.
Amenity tags are not edited very often. Among the 10.4 million map elements that at some point have had an amenity tag, only 2% (c. 195800) have changed amenity tag. By imposing suitable thresholds, we may find the most popular changes and create visualizations like the below:
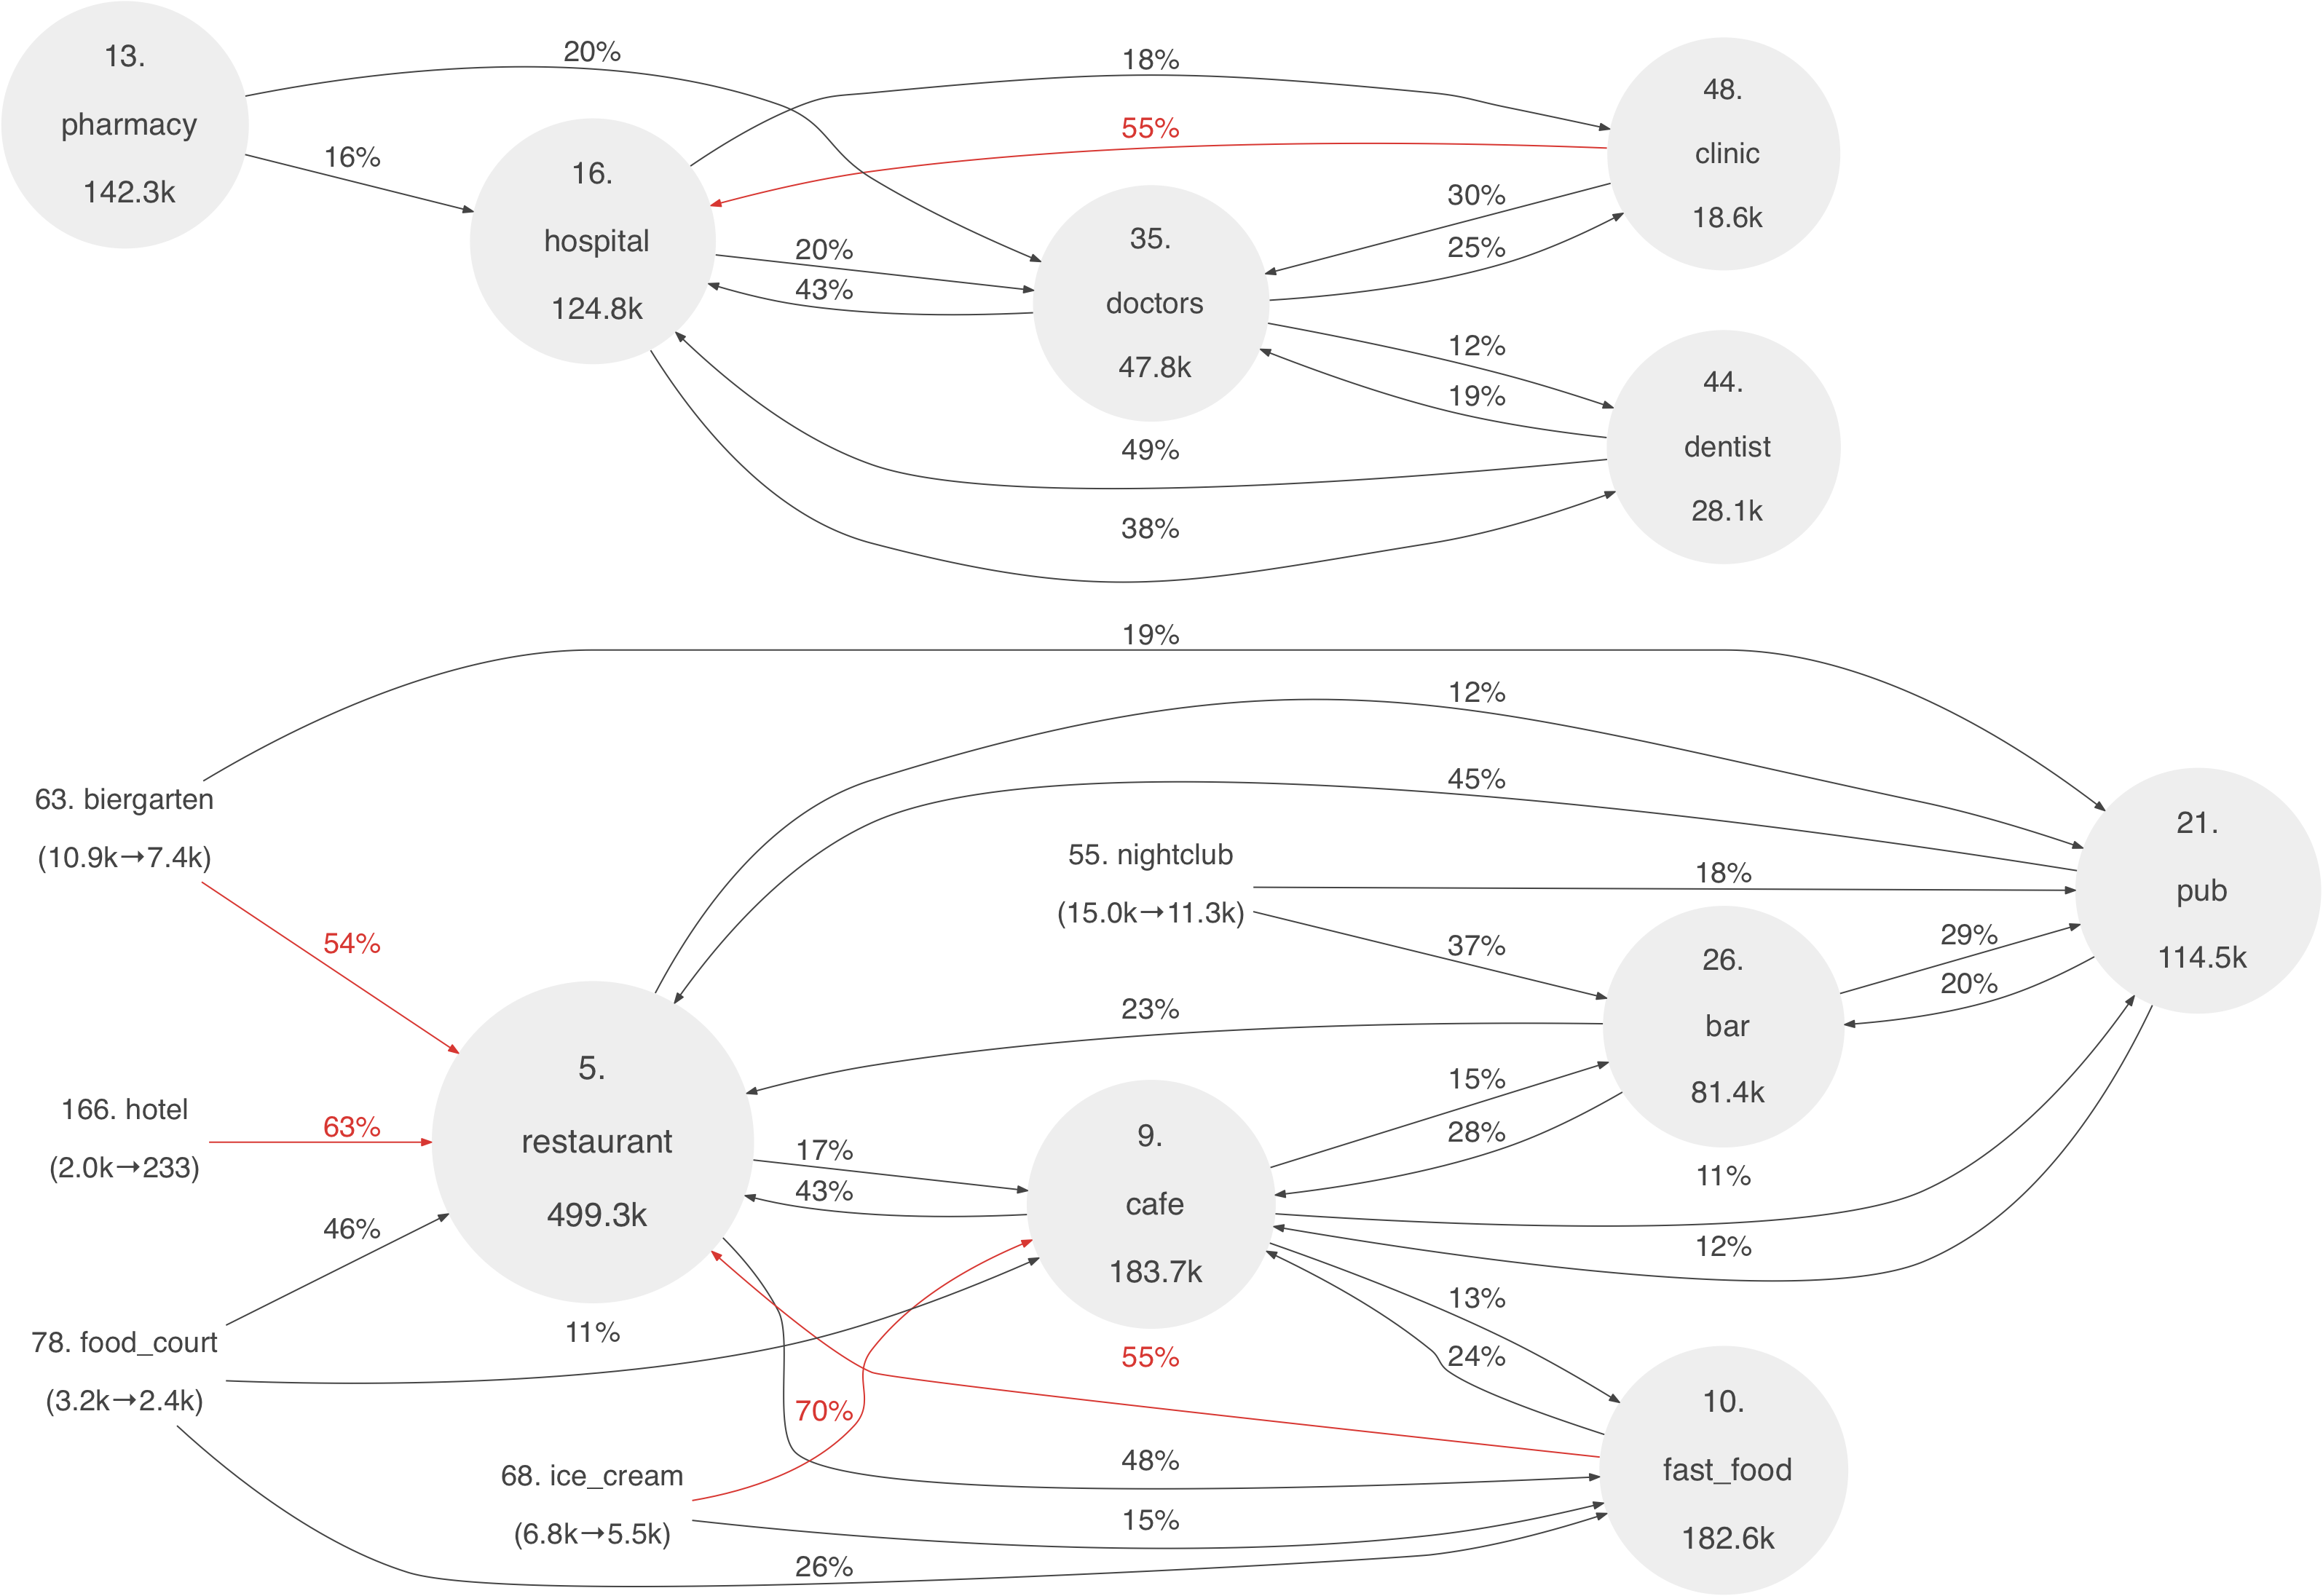
The above image is only a small excerpt of the full graph: png file, svg file. See also below for excerpts and images of other visualizations drawn with different criteria.
The meaning of the various numbers are explained in the next section (Legend), but the main content are the links (or arrows) between the amenities. These illustrate common edit patterns. Also, as explained below in more detail, red arrows are used to highlight links that represent more than half of all transitions away from a tag. Further details and comments about the above visualization is given in the section “Graph 1” below.
In addition to being edited, a map element can be deleted, an amenity-tag can be removed, or it can be retagged into another tag class, say, into a building=..-tag. Such changes are not tracked in this analysis. This work only focuses on tag changes within amenity=..-tags.
Some conclusions and possible applications are discussed at the end.
Tools and data used. The input data is the full data export from the OpenStreetMap as of 10.8.2015. Amenity elements are extracted by looping over all versions of all map elements (that is, nodes, ways and relations), and saving any map element if it has an amenity=..-tag, or if a previous version of the element has had such a tag. The script (written using the node-osmium framework) for doing this is available here. Tag names are treated as UTF-8 strings. Leading and trailing spaces are trimmed, and when imported into R, the control characters tab, newline and CR are replaced with space. For two other analyses (also written using R) that use the same data set, see link 1 and link 2.
The graphs are drawn using GraphViz. To avoid a number of spurious links, all arrows to and from the amenity=public_building-tag and amenity=yes-tag are omitted. These tags can be used as generic placeholders to indicate that a location is an unspecified public building or an unspecified amenity, see the OSM wiki. Among all tags these are at ranks 22 and 89 with c. 110900 and 1200 entries on the current map. Apart from excluding these tags, all visualizations are generated automatically from the raw OSM data and present the data as-is without any manual editing or cleaning.
One could consider this analysis as an application of process mining, that is, the task of finding patterns in case-based event logs. However, we will not use any specialized programs or R plugins for this. Most of the analysis is done using standard R and dplyr. The code is available on Github under the MIT license.
Legend
Let us first describe how to interpret the numbers and arrows in graphs like the above.
Amenity rank. The top-50 amenities are drawn in gray circles whose sizes represent the number of map elements that currently use a tag. For example, from the above excerpt we can read off that there are 183700 cafe amenities (on the current map, as of 8/2015), and when compared to other amenity tags (also on the current map) this is the 9th most popular amenity. Less popular amenities are rendered in plain text. For example, “78. food_court (3.2k→2.4k)” indicates that: (a) amenity=food_court is at rank 78 (when rank is counted as for the top-50 amenities), (b) there are c. 3200 map elements that at some point have had an amenity=food_court-tag, and (c) in the current version of the map, there are c. 2400 elements with the amenity=food_court-tag. When an amenity tag is not used by any element on the current map, no rank is neither listed. See for example the description “park_bench (1.4k→0)” in the excerpt from Graph 3 below.
The abbreviations k and M refer to 10^3 and 10^6.
Arrows and leave ratio. In graphs like the above, the arrows show common transitions between the amenities, and each percentage indicates how common a transition is among all transitions away from the source tag. Unlike rank, these percentages are computed by considering all transitions in the entire history of the OpenStreetMap. So, when these are computed, we also include tag transitions for entries that currently are (or previously have been) deleted. For the arrow tag_a → tag_b, the percentage indicates the ratio of (the total number of map elements whose amenity tag has changed from amenity=tag_a to amenity=tag_b at some point in the OSM history) to (the total number of map elements that have changed from an amenity=tag_a-tag to some different amenity=..-tag at some point in the OSM history). The purpose of this definition is to measure how probable retags tag_a → tag_b are among all transitions away from tag_a. Accordingly, we refer to this ratio as the “leave_ratio” for the link tag_a → tag_b. To be precise, it is true that this interpretation is somewhat problematic since an amenity tag can change value multiple times. For example, if tag_a, tag_b and tag_c are used by only one map element, and this element undergoes a change tag_a → tag_b → tag_a → tag_c → tag_a → tag_c, then the leave ratio for both tag_a → tag_b and tag_a → tag_c is 100% even if the transition tag_a → tag_c has occurred twice as often as tag_a → tag_b. However, this behavior is not typical. The analysis below shows that among the map elements that have changed amenity tag, 91% have changed tag only once. The above definition neither accounts for transitions into other tag families (like building=..-tags).
In the graphs, arrows are drawn in red if their leave_ratio > 50%. In addition, an amenity name is drawn in red if the total transition count away from the tag (counted within amenity tags) is more than half of the number of map elements that at some point have used the tag. This is many times the case for transitions that correct common typos in tag names, see Graphs 3 and 4 below.
In general, 0 ≤ leave_ratio ≤ 1, and the distribution of leave_ratio over all tag edits has the following shape:
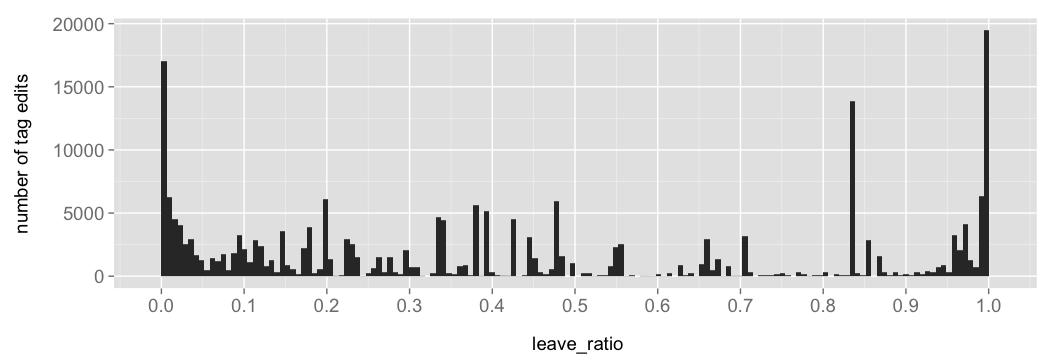
This shows a slight clustering of values in the ranges leave_ratio < 5% and leave_ratio > 95%. An example of a transition in the first range is public_building → library (3%). The interpretation of leave_ratio in this case (given in parentheses) is that public_building-elements have transitioned into a variety of different tags (387 to be exact), and only 3% of the map elements retagged from public_building-tags have been retagged to library-tags. This also motivates why the public_building-tag is excluded from the visualizations as described above. Another example is library → restaurant (1%). Again, libraries have been retagged into a number of different tags, and among all the retag events, the (unlikely) transition to a restaurant-tag motivates to the low leave_ratio of 1%. In total, the range leave_ratio < 5% accounts for 18% of all tag edits. Correspondingly, the range leave_ratio > 95% accounts for 17%. Examples of transitions with a high leave_ratio are: Cafe → cafe (95%), fontain → fountain (97%), barbeque → bbq (98%), bin → waste_basket (99%), park_bench → bench (100%) and carwash → car_wash (100%). For further examples, see Graphs 3 and 4. Often these transitions are a matter of adjusting case, fixing typos and otherwise adjusting a tag into a standard form. Such corrective edits is a part of the free-form nature of tag classification, or, folksonomy. See the Summary below.
The top tag transition is nursing_home → social_facility, which has occurred for c. 13800 map elements, see the top-50 table below. This explains the peak at 84%.
There is also a large peak at leave_ratio = 100%, and many of these are the result of transitions that have only occurred for one map element. Examples include: restaurant, bar, salle de concert → restaurant, Erste Hilfe Schule Berlin → health_school and fuel,opening_hours=24/7,kiosk=no → fuel. Each of these source tags is so descriptive that it has only been used by one map element in the entire history of the OSM. The peak at leave_ratio = 100% drops to around 6000 tag edits if we restrict to transitions that have occurred for at least 20 map elements.
The OpenStreetMap input data
As of 8/2015, the entire history of the OSM contains 10.4 million map elements that at some point have had an amenity=..-tag, and c. 23000 distinct amenity tags have been in use. Restricting to the current version of the map, these numbers drop. Then the number of amenity map elements is 8.9 million and the number of distinct amenity tags is only c. 8400. The latter number further drops to c. 800 if we only consider amenity tags currently used by at least 10 map elements.
The top-10 amenities. The below table shows the top-10 amenity tags together with the number of unique map elements that use each tag (a) in the entire history of the OSM and (b) on the current map (as of 8/2015):
| Amenity tag | Total count | Current count | |
|---|---|---|---|
| 1 | parking | 2.1M | 1.8M |
| 2 | place_of_worship | 891.1k | 695.5k |
| 3 | school | 903.6k | 662.5k |
| 4 | bench | 526.5k | 507.8k |
| 5 | restaurant | 598.1k | 499.3k |
| 6 | fuel | 349.3k | 263.3k |
| 7 | bank | 220.5k | 184.9k |
| 8 | post_box | 200.5k | 184.0k |
| 9 | cafe | 218.5k | 183.7k |
| 10 | fast_food | 218.6k | 182.6k |
Further details about the most popular amenity tags can be found on the taginfo webpage.
The top-50 tag transitions. We start with all versions of all amenity map elements extracted from the OSM. From these, we filter out those edits that have changed the amenity tag. This yields a data frame with the below structure:
| unique_id | from | to |
|---|---|---|
| n1291310317 | recycling | waste_dispostal |
| n1291310317 | waste_dispostal | waste_disposal |
| n1291314063 | hospital | doctors |
| n1291315459 | recycling | waste_disposal |
| n1291415629 | Fast food | fast_food |
| n1291510038 | restaurant | cafe |
In the setting of process mining, this data format has been discussed in this post on the Flux Capacitor blog.
Next, for each tag transition, say, hospital → doctors, we count for how many map elements it has occurred. This yields a new table with columns from, to and transition_count and one row for each (from, to)-pair. The top-50 transitions (listed with their leave_ratio) are:
| rank | from | to | leave_ratio | transition_count |
|---|---|---|---|---|
| 1 | nursing_home | social_facility | 84% | 13758 |
| 2 | restaurant | fast_food | 48% | 5871 |
| 3 | hospital | dentist | 38% | 5610 |
| 4 | parking_space | parking | 99% | 5055 |
| 5 | school | kindergarten | 39% | 4877 |
| 6 | parking | parking;fuel | 34% | 4389 |
| 7 | parking | parking_space | 33% | 4258 |
| 8 | cafe | restaurant | 43% | 3126 |
| 9 | hospital | doctors | 20% | 2960 |
| 10 | pub | restaurant | 45% | 2933 |
| 11 | college | school | 66% | 2837 |
| 12 | school | college | 23% | 2808 |
| 13 | hospital | clinic | 18% | 2697 |
| 14 | public_building | townhall | 20% | 2680 |
| 15 | recycling | waste_disposal | 71% | 2675 |
| 16 | atm | bank | 86% | 2518 |
| 17 | fast_food | restaurant | 55% | 2449 |
| 18 | nursing_home | community_centre | 15% | 2417 |
| 19 | restaurant | cafe | 17% | 2089 |
| 20 | bank;atm | bank | 96% | 2071 |
| 21 | town_hall | townhall | 97% | 1731 |
| 22 | bank | atm | 49% | 1551 |
| 23 | bar | pub | 29% | 1507 |
| 24 | restaurant | pub | 12% | 1447 |
| 25 | bar | cafe | 28% | 1433 |
| 26 | kindergarten | school | 55% | 1429 |
| 27 | hospital | veterinary | 10% | 1411 |
| 28 | school | university | 11% | 1396 |
| 29 | fountain | drinking_water | 87% | 1381 |
| 30 | park_bench | bench | 100% | 1350 |
| 31 | pub | bar | 20% | 1342 |
| 32 | parking | parking_entrance | 10% | 1315 |
| 33 | townhall | school | 45% | 1314 |
| 34 | public_building | community_centre | 9% | 1243 |
| 35 | doctor | doctors | 97% | 1240 |
| 36 | post_box | post_office | 67% | 1233 |
| 37 | public_building | school | 9% | 1226 |
| 38 | bar | restaurant | 23% | 1195 |
| 39 | college | university | 27% | 1146 |
| 40 | cafe | bar | 15% | 1069 |
| 41 | fast_food | cafe | 24% | 1060 |
| 42 | cafe | fast_food | 13% | 976 |
| 43 | doctors | hospital | 43% | 924 |
| 44 | restaurant | bar | 7% | 890 |
| 45 | public_building | place_of_worship | 6% | 866 |
| 46 | bus_station | bus_stop | 63% | 833 |
| 46 | cafe | pub | 11% | 833 |
| 47 | waste_basket | waste_disposal | 65% | 813 |
| 48 | Kindergarten | kindergarten | 97% | 807 |
| 49 | clinic | hospital | 55% | 801 |
| 49 | pub | cafe | 12% | 801 |
| 50 | kindergarden | kindergarten | 96% | 791 |
In total, there are c. 20800 distinct (from, to)-pairs. When we restrict to transitions that have occurred for at least 10 map elements, this number drops to 1400.
The number of tag edits per map element. In total, there are 10.4 million map elements that at some point have had an amenity=..-tag. Of these, only 2% percent (c. 195800) have changed amenity tag. Next, we consider the distribution of the number of tag changes per map element:
| Number of tag edits | 1 | 2 | 3 | 4 | 5 | 6 | 7 | 8 | 9 | 11 | 15 | 60 |
| Unique map elements | 178038 | 15334 | 1861 | 388 | 90 | 27 | 7 | 5 | 2 | 1 | 1 | 1 |
This shows that among the c. 195800 map elements that at some point have changed amenity tag, 91% (178038) have changed tag only once. This indicates that the amenity tags do not tend to change frequently. If a tag has changed, one change is generally sufficient. Also, there are only 44 map elements whose amenity=..-tag has been edited more than 5 times.
Visualizations
Graph 1: Strong links between the top-250 amenities
Graph 1 shows links between the top-250 amenity tags. Let us first note that these include amenities with the same element count, and therefore the top-250 amenities contain a total of 323 different amenity tags. Alternatively, these roughly correspond to those amenities with more than 50 map elements on the current map.
To draw Graph 1, we query for transitions (between the top-250 amenities) such that: (a) leave_ratio is above 10% and (b) the transition has occurred for at least 40 map elements. These conditions are met by 139 transitions that involve 94 amenities (out of 323). A small excerpt is shown in the introduction together with links to the full graph.
From the full graph, we see that the links divide the amenities into a number of disconnected clusters, or components, that each is loosely related to one topic. The excerpt shows two components: one related to health care and another with different kinds of restaurants.
The links bank → bench and embassy → parking_space (seen in the full graph) might seem odd. The first one indicates that amenity=bank-tags have commonly been edited into amenity=bench-tags. This edit has occurred for 343 map elements. An explanation is that in German, both “bank” and “bench” mean bench. See also the OSM wiki talk page referenced in Graph 3. The transition embassy → parking_space, in turn, has occurred for 173 map elements, and these seem to be due to one large changeset in the city of Paris.
Graph 2: Links between the top-250 amenities
Graph 2 is created in the same way as Graph 1, but the conditions are slightly weaker. Graph 2 includes all links between the top-250 amenities that: (a) have leave_ratio above 5.1% and (b) have occurred for at least 12 map elements. These conditions are satisfied by 243 transitions that involve 137 amenities (out of 323).
A small excerpt showing one component related to water is shown below:
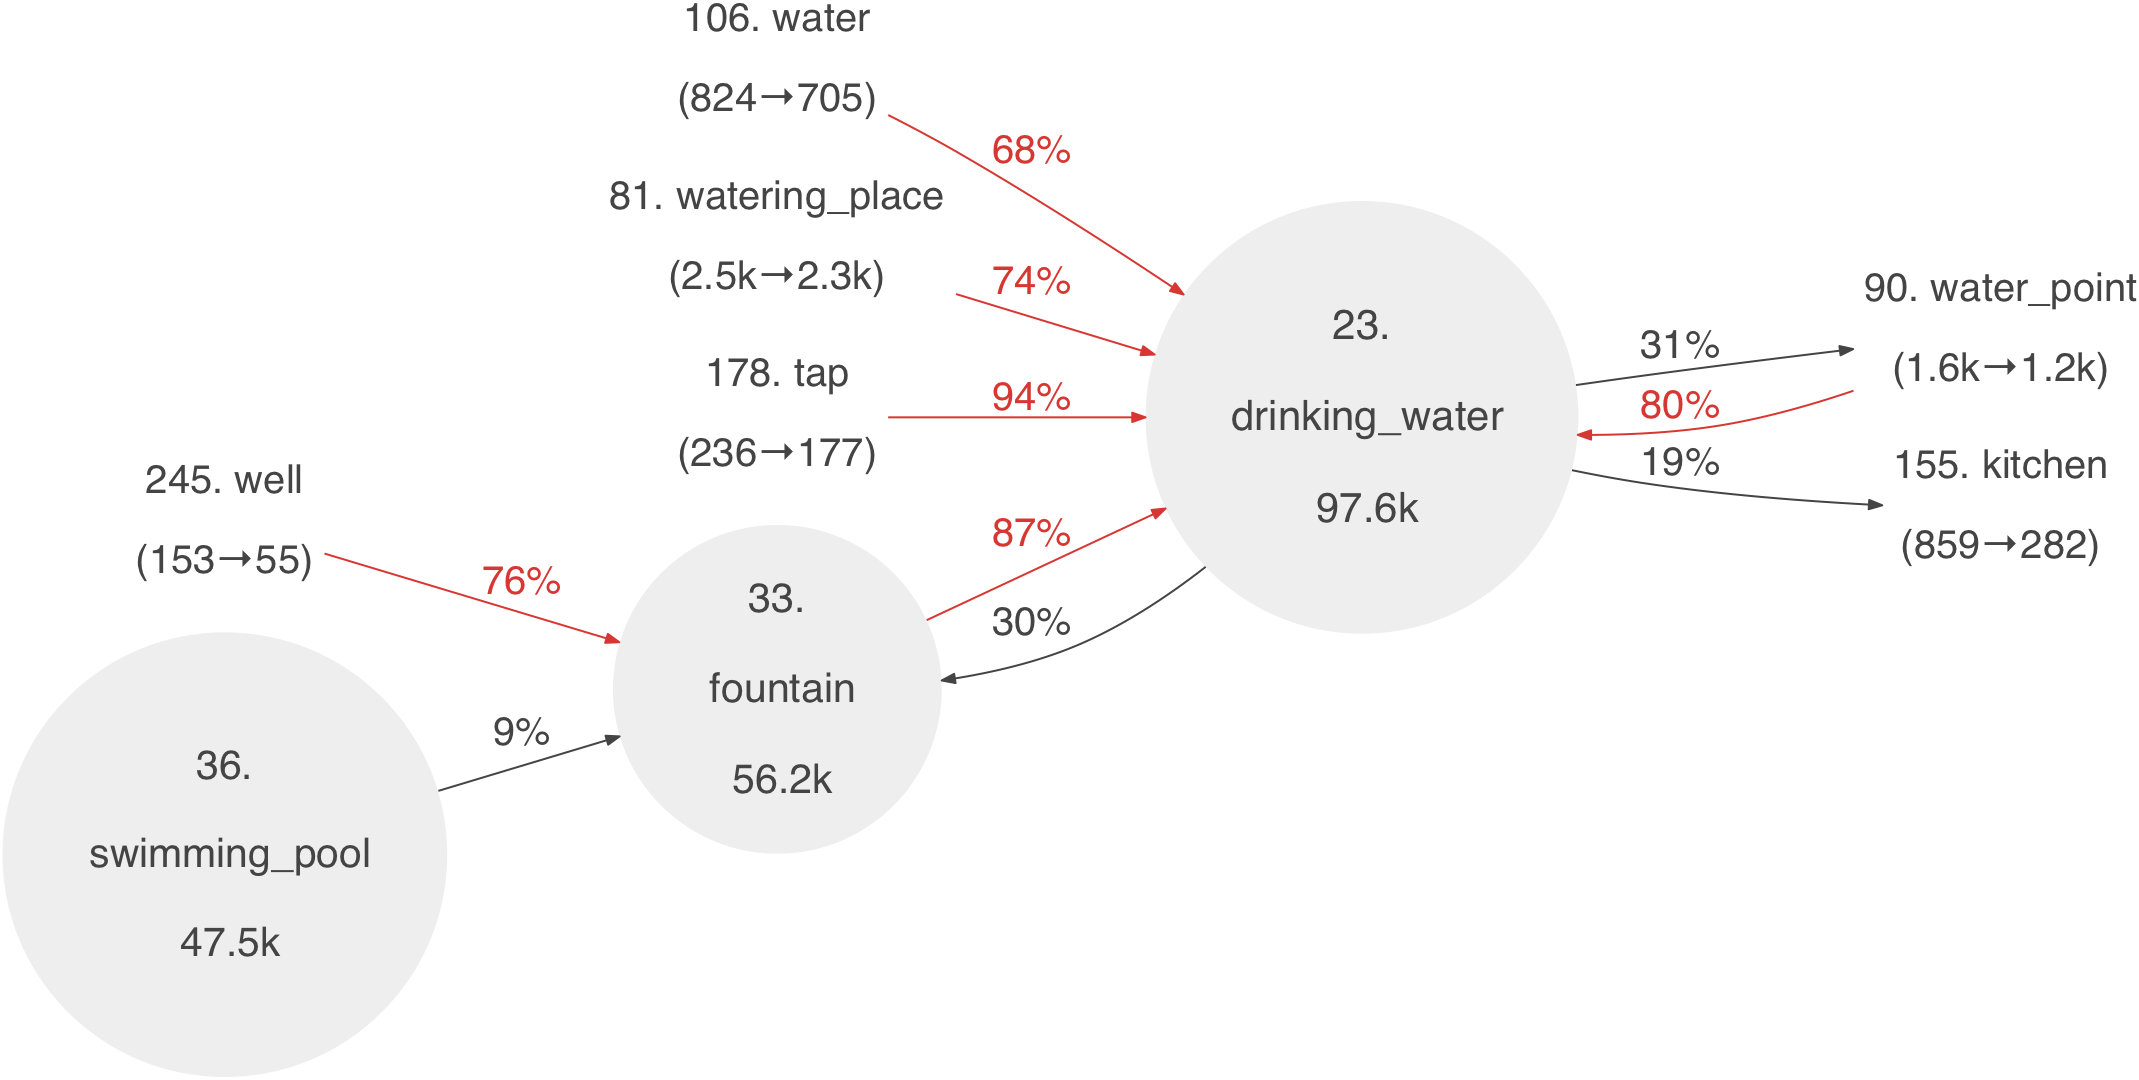
The full graph: png file, svg file.
One can think of Graph 2 as showing the same tag network as Graph 1, but with a higher zoom level. From Graph 2 one also sees that the different components in Graph 1 start to merge. For example, in Graph 2 both parking (at rank 1) and restaurant (at rank 5) are connected via links from construction (at rank 200). By further lowering the thresholds one can obtain even more detailed visualizations. These can quickly become difficult to read if there are too many links and amenities. Some of the arrows in Graph 2 are already difficult to follow.
Graph 3: Links with a high leave_ratio
Since tags can be entered as free-form text, the OpenStreetMap contains some tags that are essentially the same, but show slight variation in spelling, choice of words, case, and in the use of space vs. dash vs. underscore, etc. For example, bench, benches, parkbench, park bench, Park bench and park_bench have all been used. To find examples of edits that correct these kinds of synonyms, let us query for transitions tag_a → tag_b where: (a) tag_a has been used by at least 100 map elements in the full history, (b) tag_a is currently used by at most 10 elements, and (c) leave_ratio > 50%. These criteria are met by 52 transitions that involve 88 amenity tags. A small excerpt is shown below:
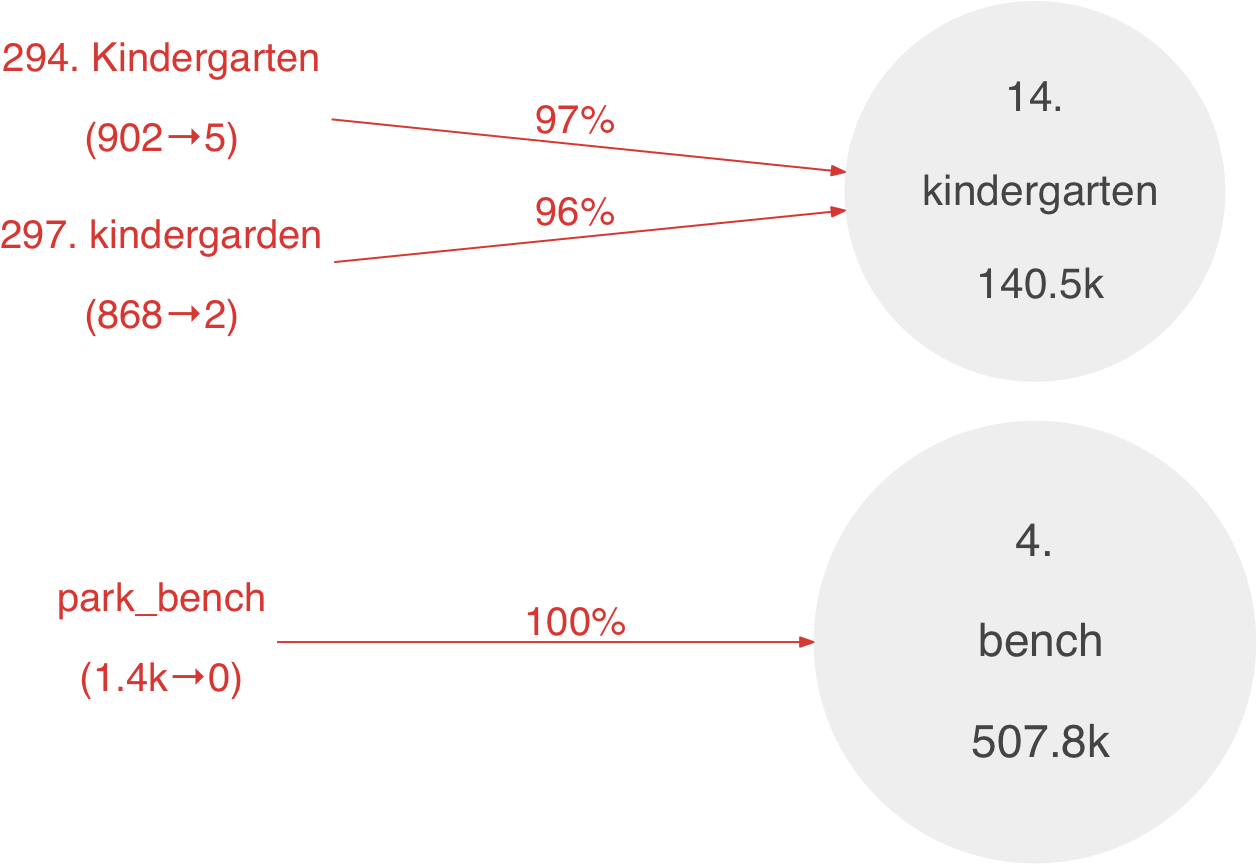
The full graph: png file, svg file.
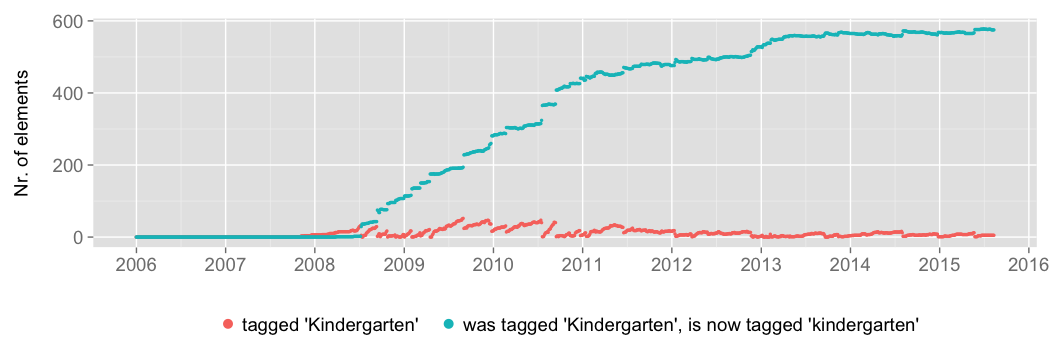
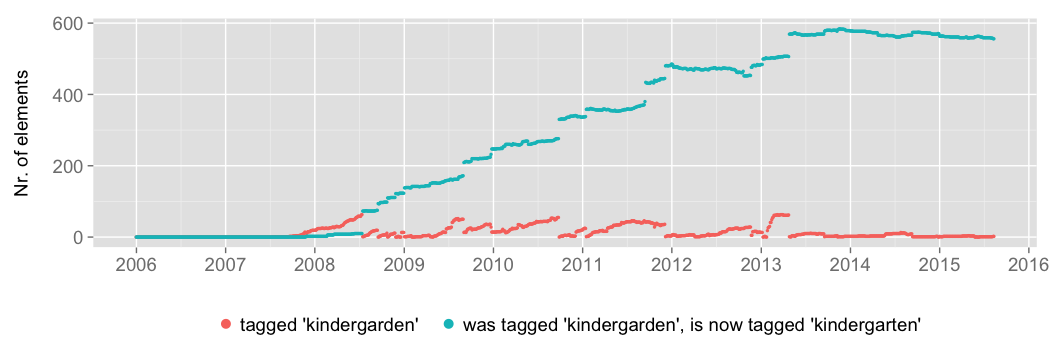
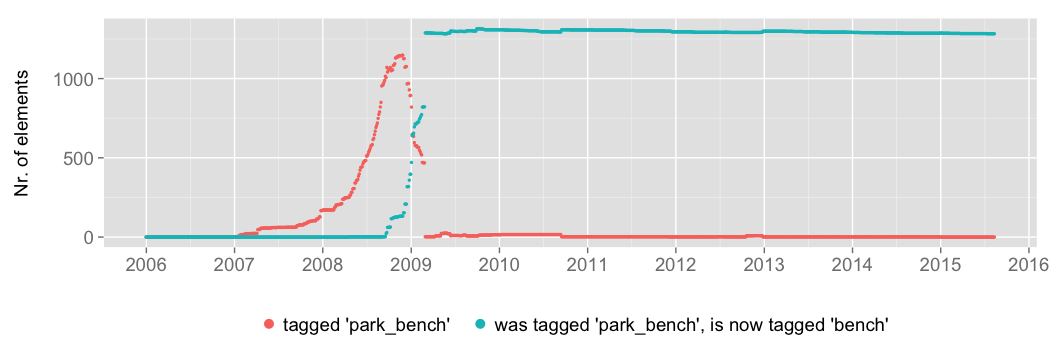
Let us emphasize that the OpenStreetMap is constantly edited, and its evolution is an ongoing process. It is therefore motivated to also investigate how the transitions in the above excerpt have happened over time. This is plotted below. In the first two plots, the edits seem to occur in smaller batches spread out over time. A possible explanation is the taginfo webpage, which contains a list of the most popular amenity tags. Thus, assuming that this list is actively used by OSM contributors, one should not expect non-standard tag variants like Kindergarten or kindergarden to become too popular. The third plot for park_bench → bench shows a different edit pattern, where all map elements are essentially retagged around 12/2008. This is approximately the same time the bench tag was approved, OSM wiki. (On this OSM wiki page, the associated talk page also discusses the use of bench vs. park_bench.)
Graph 4: Links to and from one selected amenity=.. tag
The previous graphs visualize transitions between all amenity tags under various criteria. A difficulty when selecting these criteria is that they necessarily need to impose strong conditions. Otherwise the graphs can become so cluttered that they can be difficult to read. An alternative approach is to start from one amenity tag and draw all links to and from this tag that satisfy some suitable criteria (which can now be much weaker). This would of course best be implemented interactively, so that the user can select which tag to start from. However, as an illustration, the below image shows all transitions to and from the waste_basket-tag with: (a) 4 or more transitions, and (b) leave_ratio > 1%:
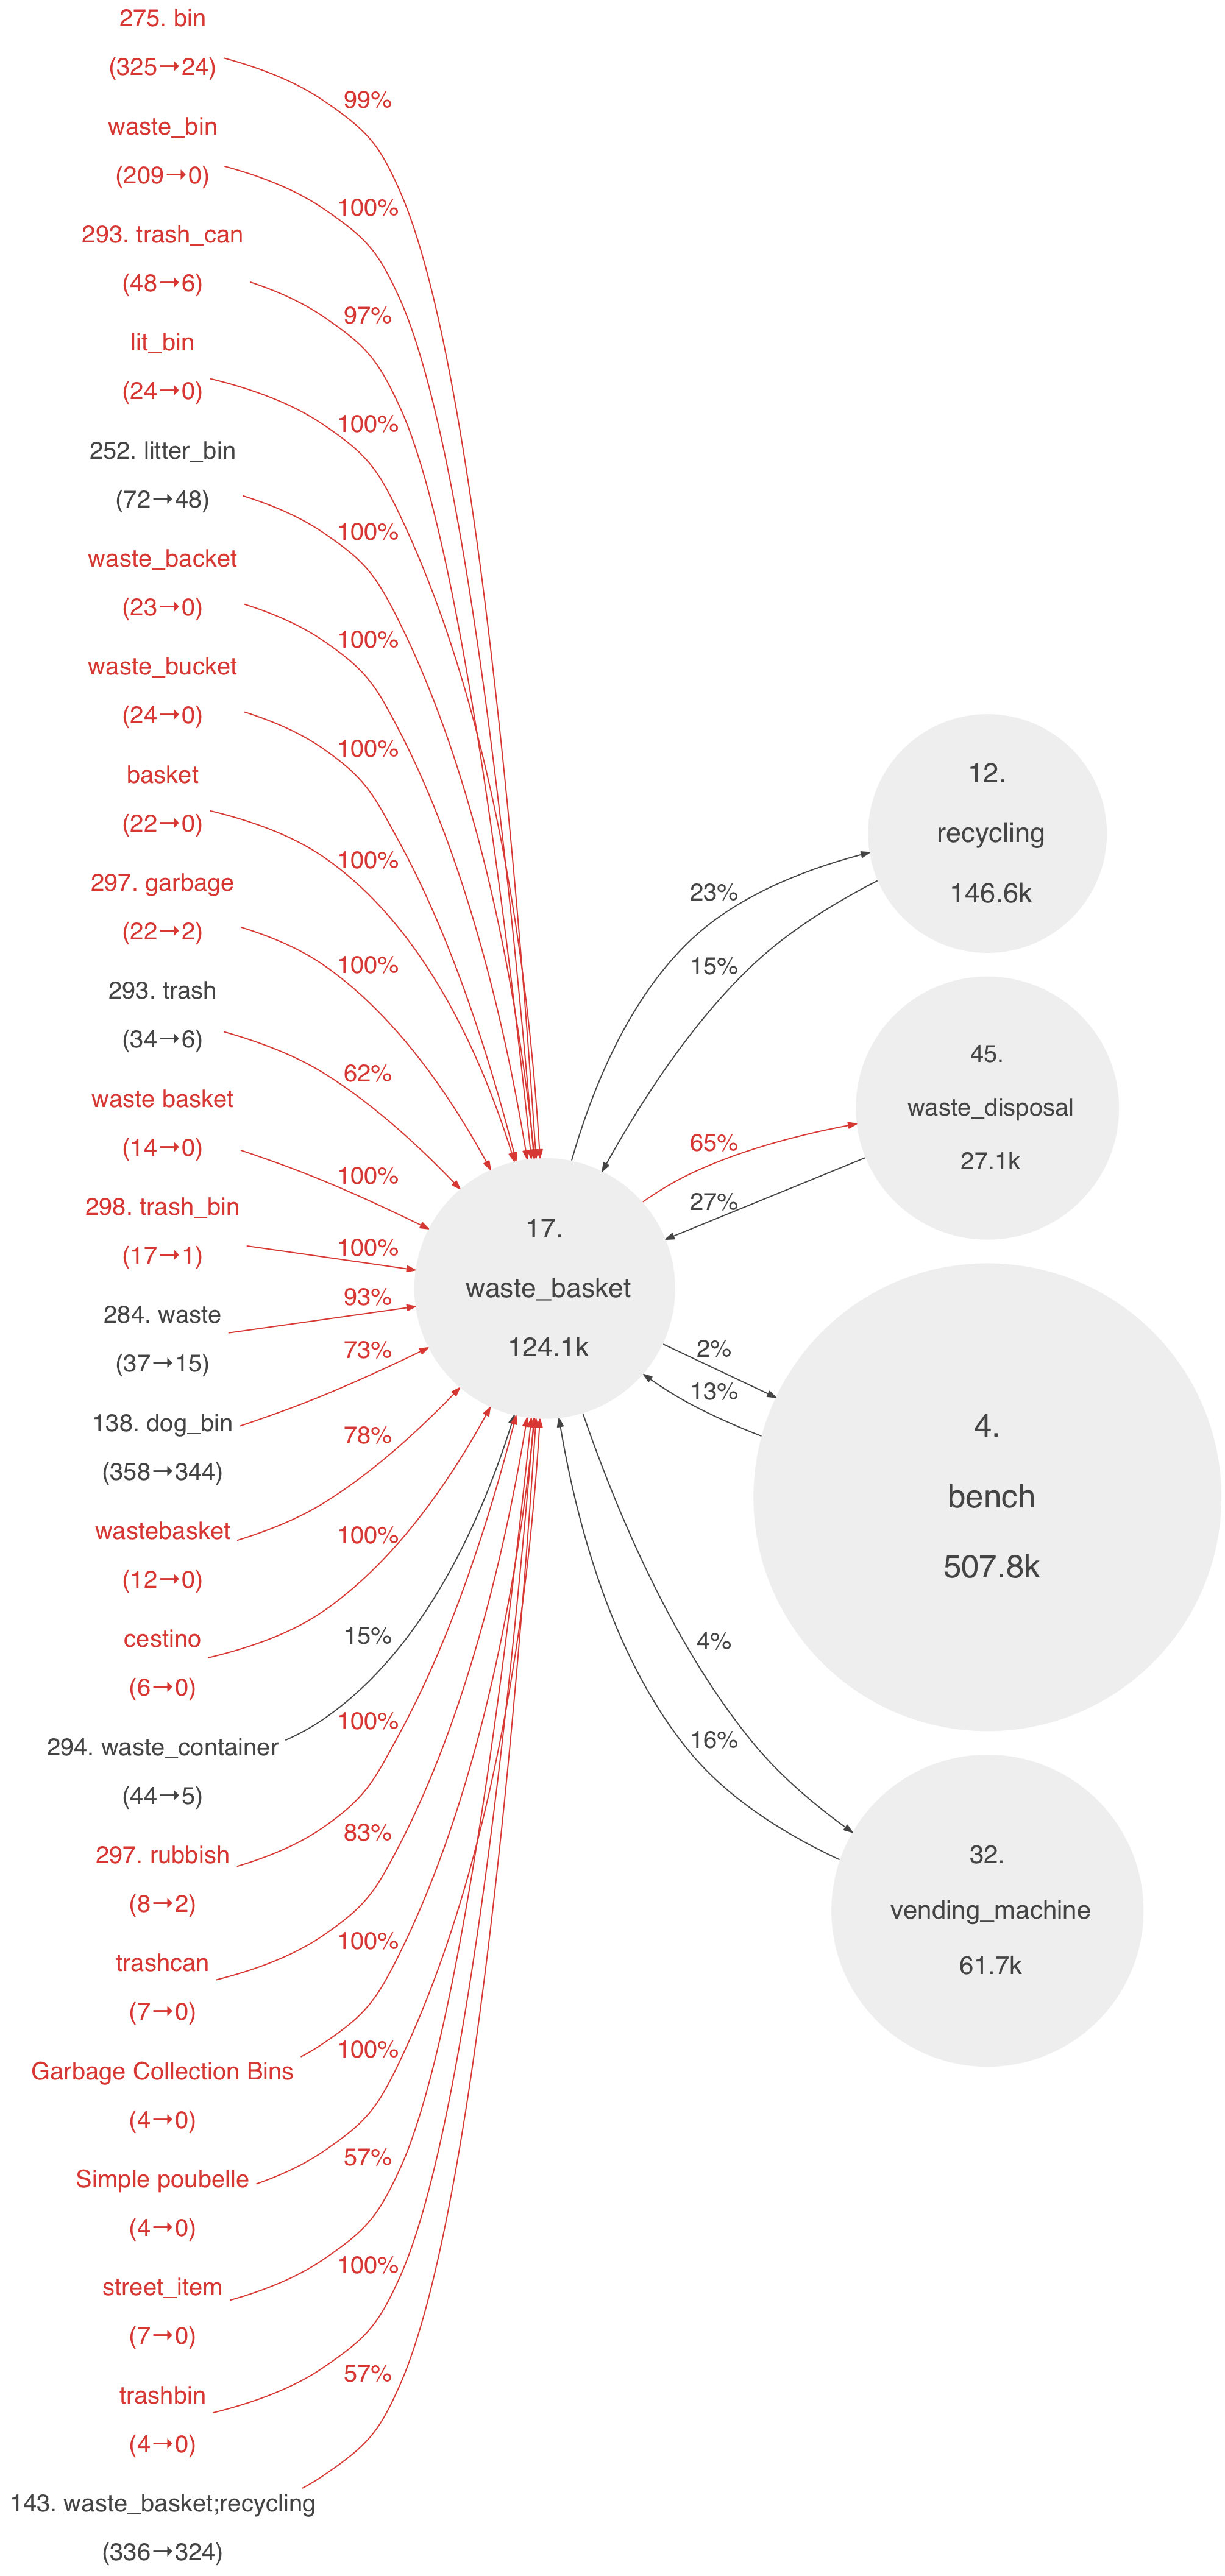
These kinds of graphs could be useful for finding synonyms and alternative names for common tags. In comparison, the waste_basket.json file used by the iD-editor currently has only four entries: rubbish, litter, trash and garbage (as of 12/2015). Let us here note that to include additional synonyms into the json file from graphs like the above, one might first need to ensure that the license of the extracted OSM data and the license for the iD-editor are compatible. This might be particularly relevant if this is done systematically.
Summary and possible application
A main conclusion of this work is that one can link together related tags on the OpenStreetMap by tracking how they are edited over time. As seen above, the edit patterns may arise from various mechanisms. However, all the patterns represent real edit events in the historical OSM data.
Understanding common edit patterns could potentially be useful for various applications, such as for documentation, guiding policy and for keeping the OSM wiki up-to-date. Tag relationships might also give insight into which tags are commonly mixed up. That, in turn, could be used to improve the edit process. For example, by giving just-in-time documentation and tag alternatives after a tag has been entered in a map editor. Due to the active nature of the OSM project, even small improvements could have an impact. The number of new map elements currently added per day is in the order of 1 million, see the OSM wiki, OSMstats.
As seen in Graphs 1 and 2, the above analysis allows us to organize individual tags into more generic categories related to eating, healthcare, water, etc. Understanding these categories could be beneficial for search. A user looking for a restaurant might also be interested in cafés. Furthermore, if we understand how tags organize into categories (and subcategories), this could be helpful when designing mapping softwares: to describe a location, one could start with a list of generic categories and progressively drill down to more detailed menus with individual tags. This might be particularly relevant on mobile devices where screen space is limited. These kinds of menus are also used. For example, in the iD editor, tag selection is based on a combination of menus and search. The menus also take into account the type of the element (point, line, area). Another hierarchical menu of OSM-tags can be found in the Humanitarian OpenStreetMap Team’s Visual Tag Chooser, see link 1 and link 2. (As of 12/2015, this project has recently been rewritten, see the new repository, live site). Both of these examples organize popular tags into categories (and they are not restricted to just amenity-tags). However, a difficulty might be to keep these categories up-to-date. For the iD editor, this is done using Github issues, and the categories are stored in JSON files. For this task, this analysis could be used as a basis for making the maintenance of these files more automatic, and data-driven. See the comment after Graph 4. Also, if we can – at least semi-automatically – find groups of related tags, these could be compared with the categories in the iD-editor and the Visual Tag Chooser. Such a comparison would likely include manual steps. However, if this process could be simplified, it might motivate the inclusion of less popular tags into the categories and selection menus.
Automatic edits are generally discouraged on the OSM, although fixing obvious typos is listed as an acceptable usage. From Graphs 3 and 4, one can find a number of edit patterns that could potentially be automated. For example, Kindergarten → kindergarten and bus station → bus_station should be relatively obvious. Less obvious might be synonyms like bin → waste_basket and phone → telephone. Alternatively, these kinds of edit patterns might be of interest to new users. Fixing synonyms and simple typos (and the OSM does contain typos), could be a first step towards contributing to the OSM by starting with rather mechanical tasks. This would probably require some kind of discussion and guide, and such editing would be armchair editing, which is considered controversial, see the OSM wiki. On the other hand, it could be a way to learn how to edit the OpenStreetMap and to understand how information is represented using tags. For a talk that – among also other things – discusses the numbers related to new user engagements, see the 2014 SotM talk by Harry Wood, The Long Tail of OpenStreetMap.
Here we have only considered amenity=..-tags, which form one of the most popular tag classes on the OpenStreetMap. With some changes, it should be straightforward to repeat this analysis also for other classes like for building=..-tags and for natural=..-tags, etc. For a list of all tag classes, see the taginfo webpage. However, a natural next step could also be to perform the analysis on all the top tag-classes at the same time. Then one could find transitions from, say, amenity=well (taginfo) to man_made=well (taginfo). An approach for this could be to start with a preprocessing step, where the tag family and the tag value are combined into one string. Then the above transition could be represented as am:well → mm:well. However, this is a different problem and would require further work. For example, it does not make sense to track changes in all the top tag classes (like for the addr:housenumber-tag class), so one would need to exclude some classes. Also, it might be possible that some map elements have both an amenity-tag and a man_made-tag, and one would need to decide how to process such elements. If they are very rare, one could maybe omit them.
As a final note, let us remark that tags on the OpenStreetMap are actually key-value pairs. Another common tagging method is to describe an object by a list of words. For example, on StackOverflow a question might be tagged with the words gis and gps. When such tags can be entered free-form and when they can be edited by (a large number of) users, the classification is usually known as a folksonomy. This is a similar technique to tagging on the OSM. Internet searches for words like “mining, tag, clustering, folksonomy” return a number of research papers on clustering tags and finding related tags in folksonomies. However, these do not seem to make use of historical version data (?).
Comments, corrections and questions are welcome.
OSM License
The above analysis is based on data from the OpenStreetMap project, © OpenStreetMap contributors. The OSM data is available under the ODbL. The code for this analysis can be downloaded (under the MIT license) from here.